By Craig Winn, HD charting portfolio manager
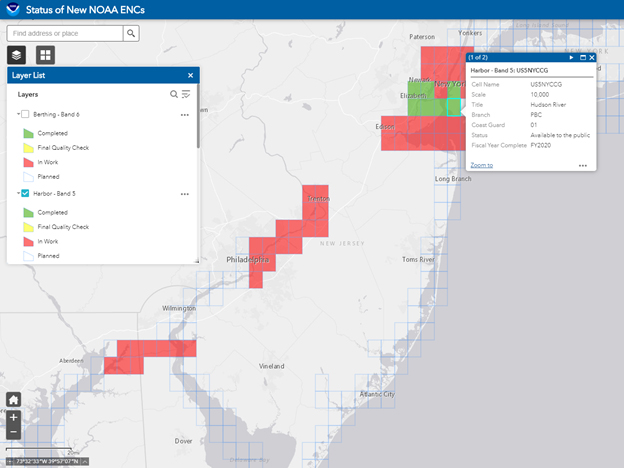
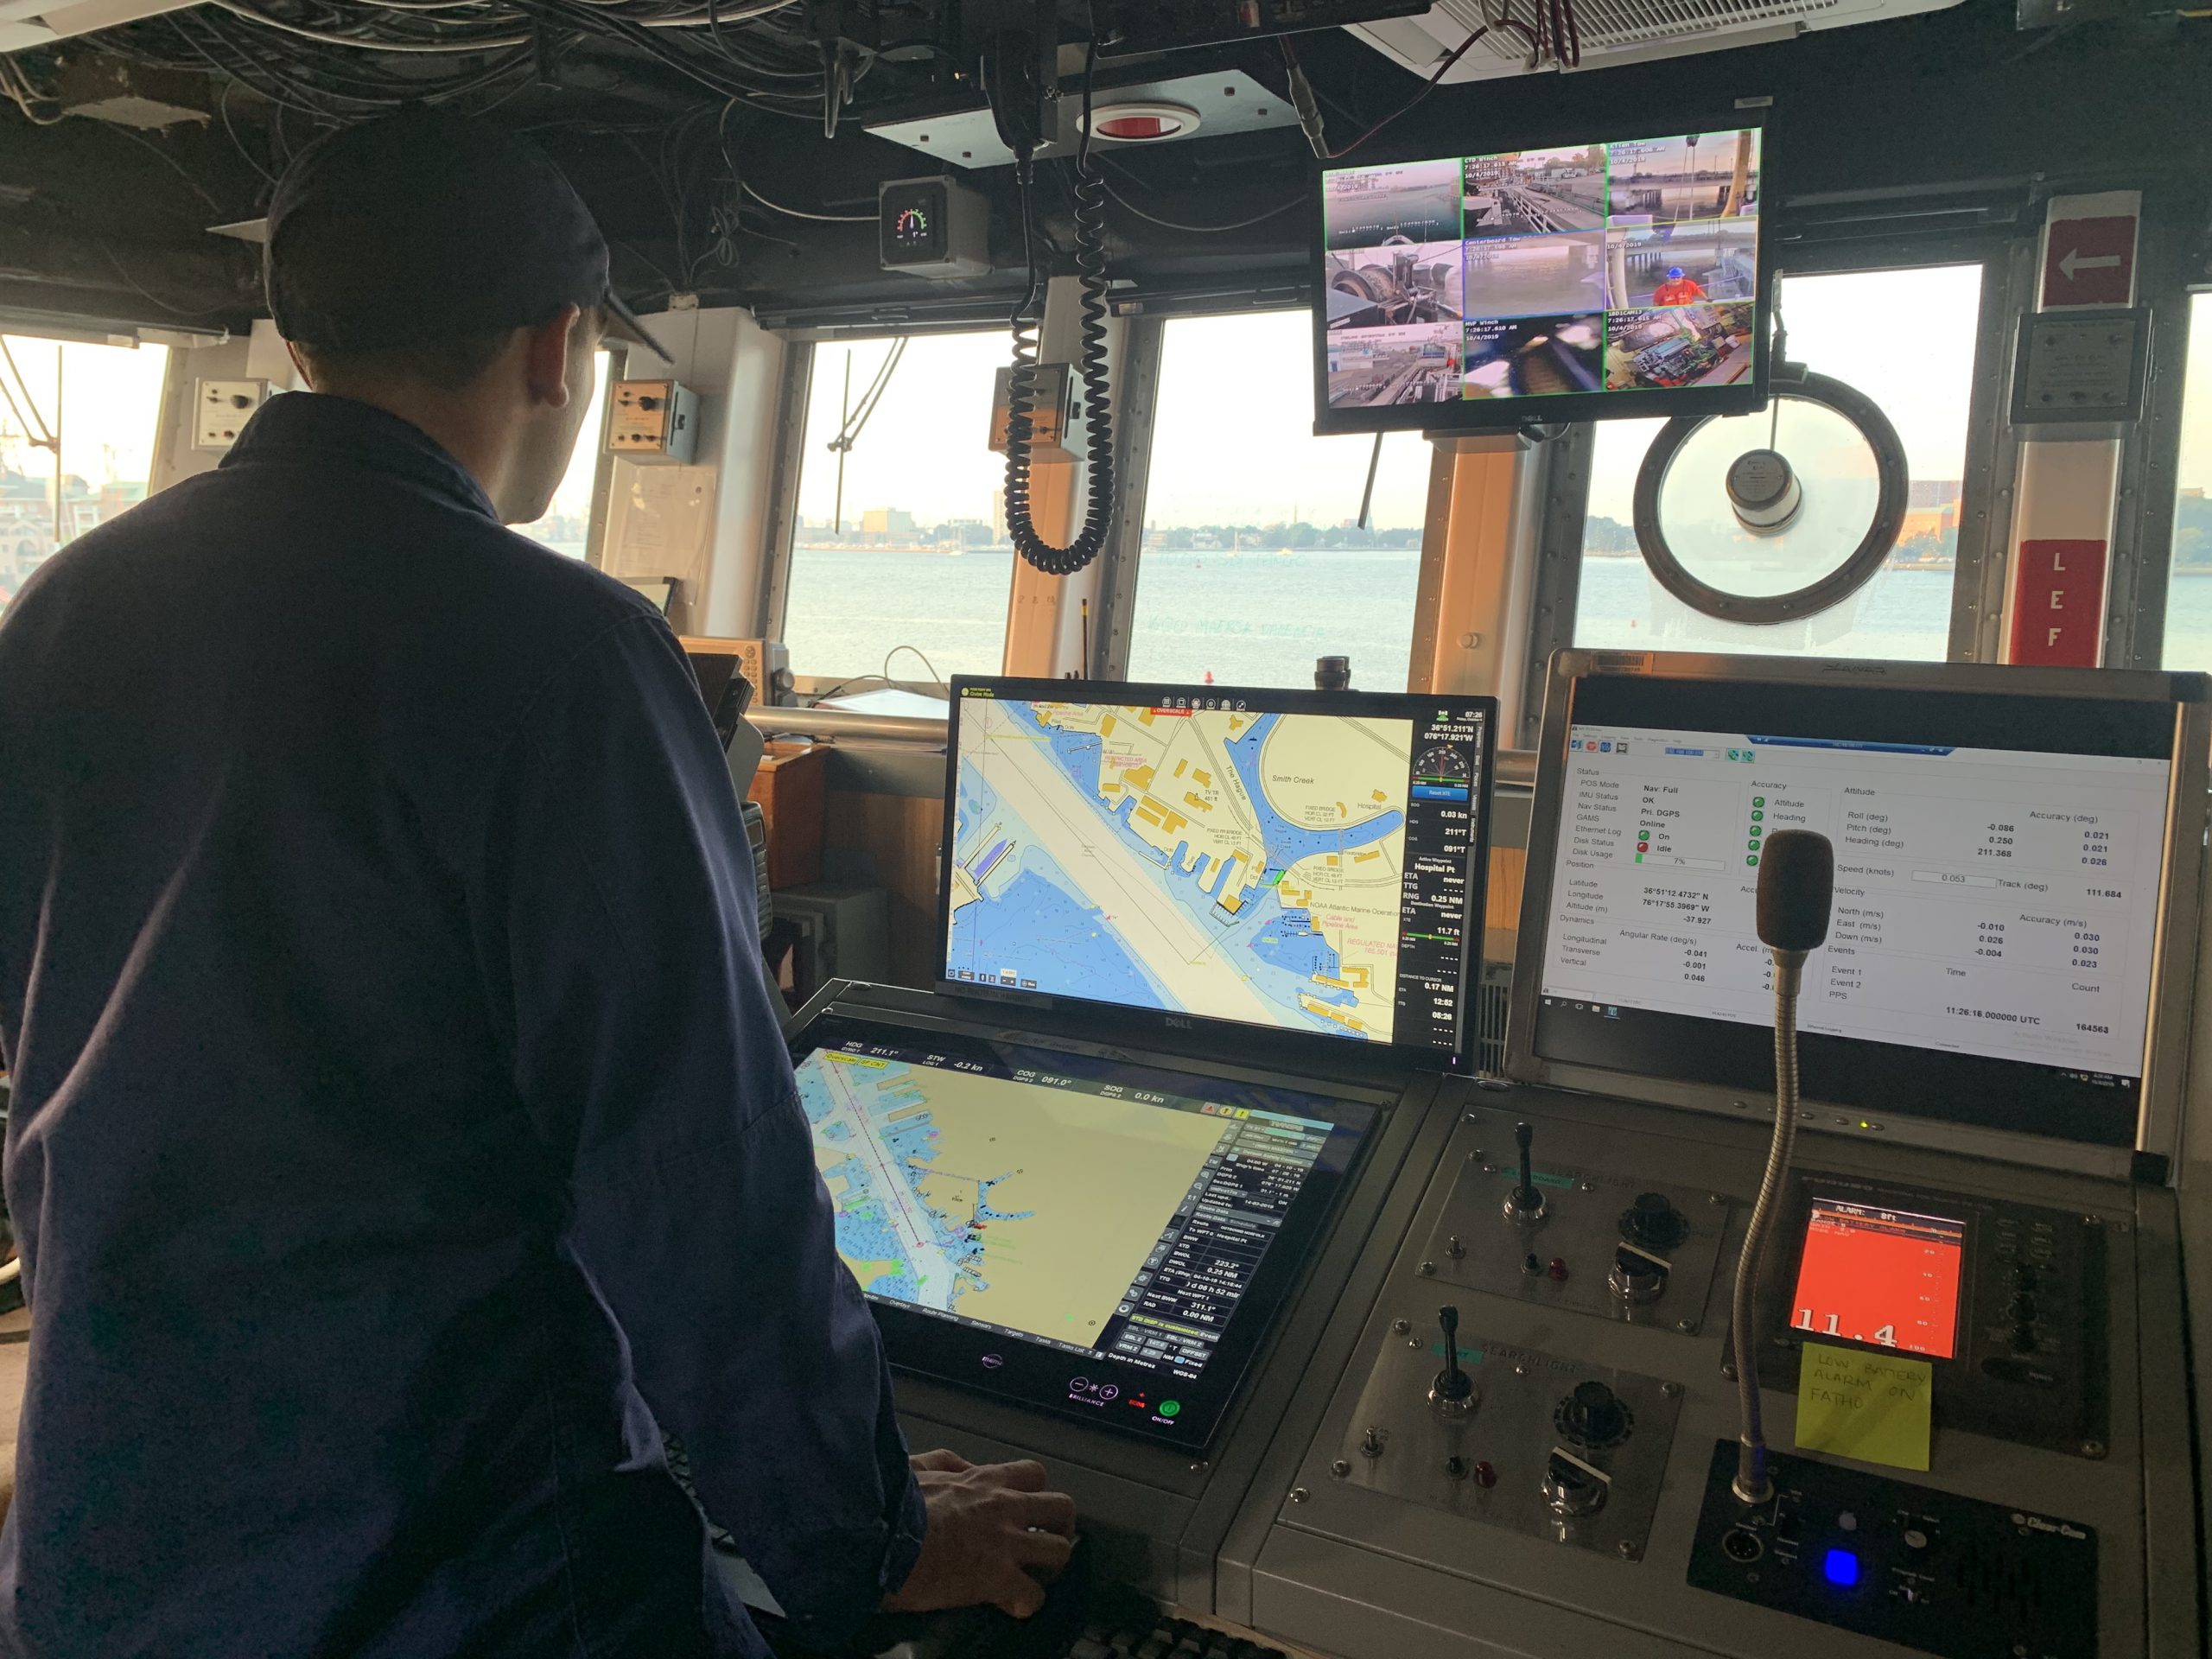
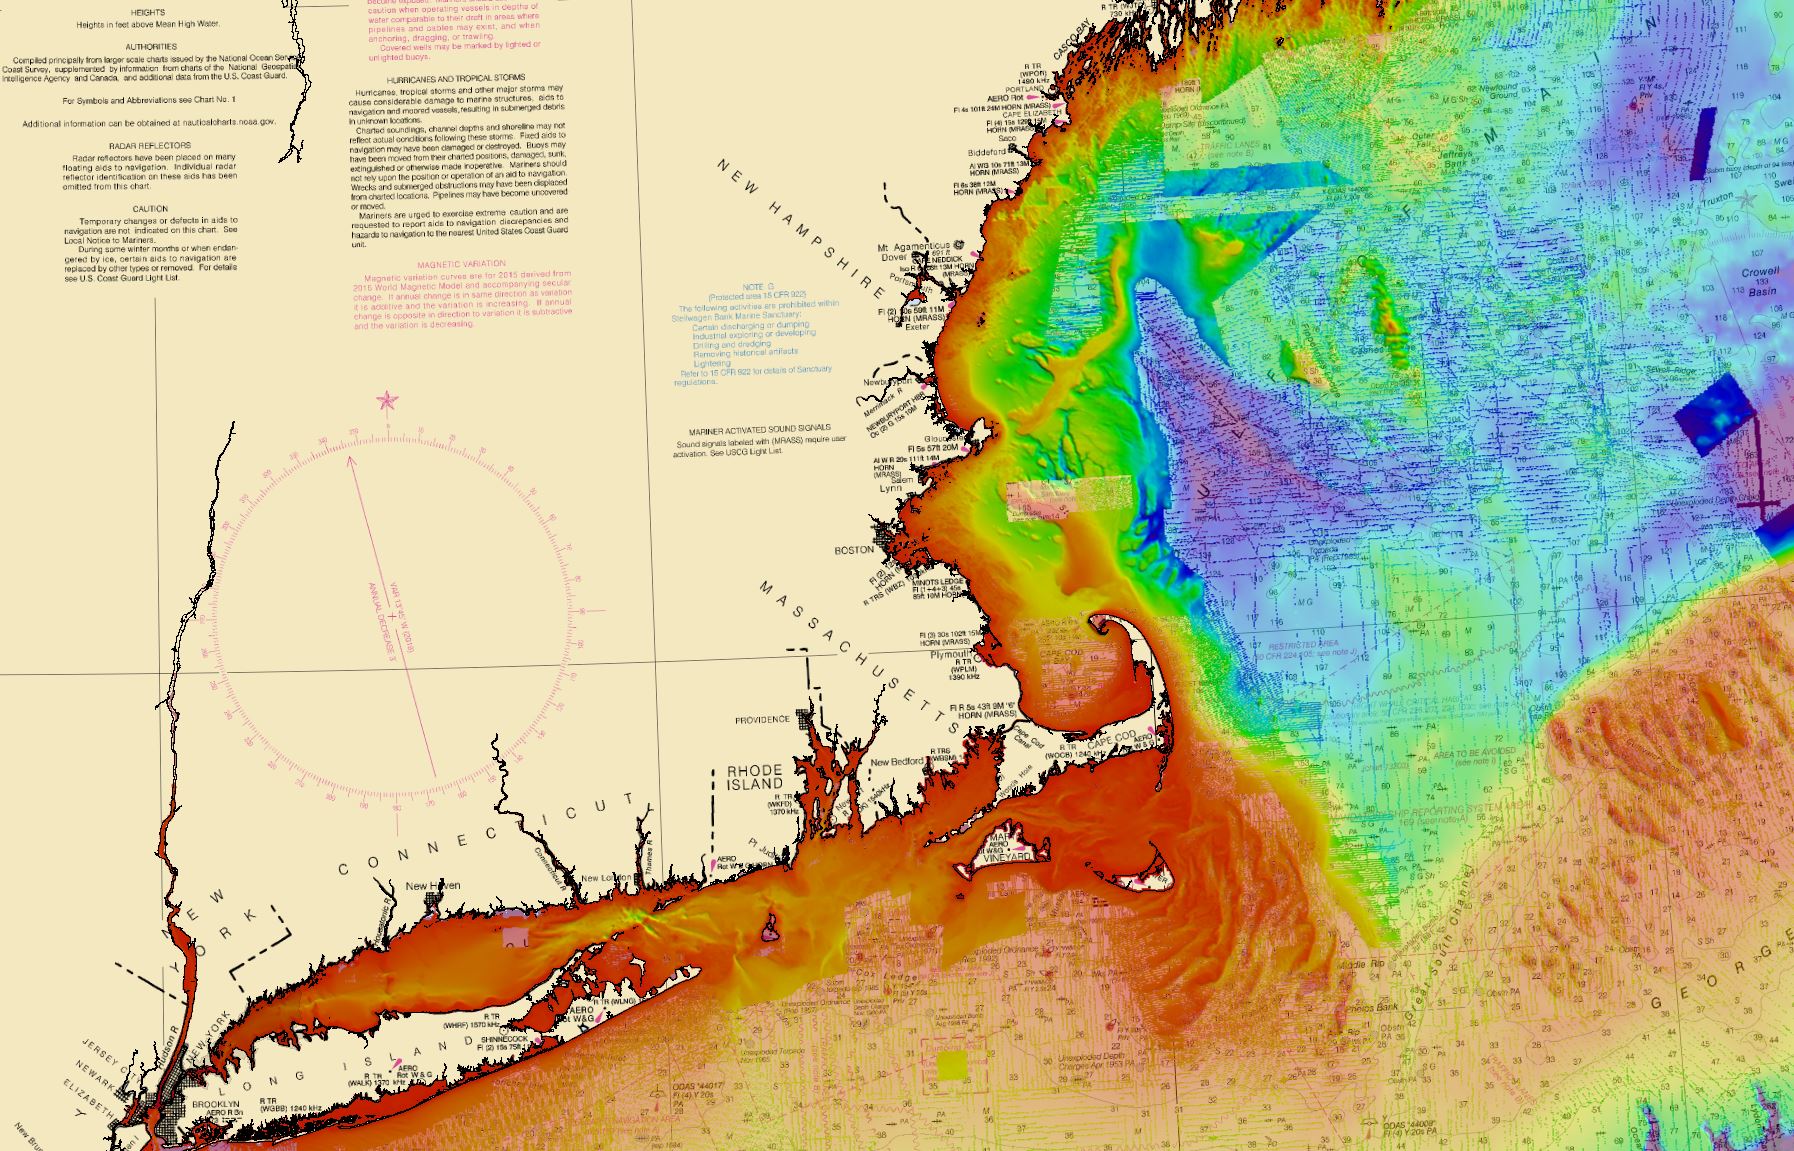
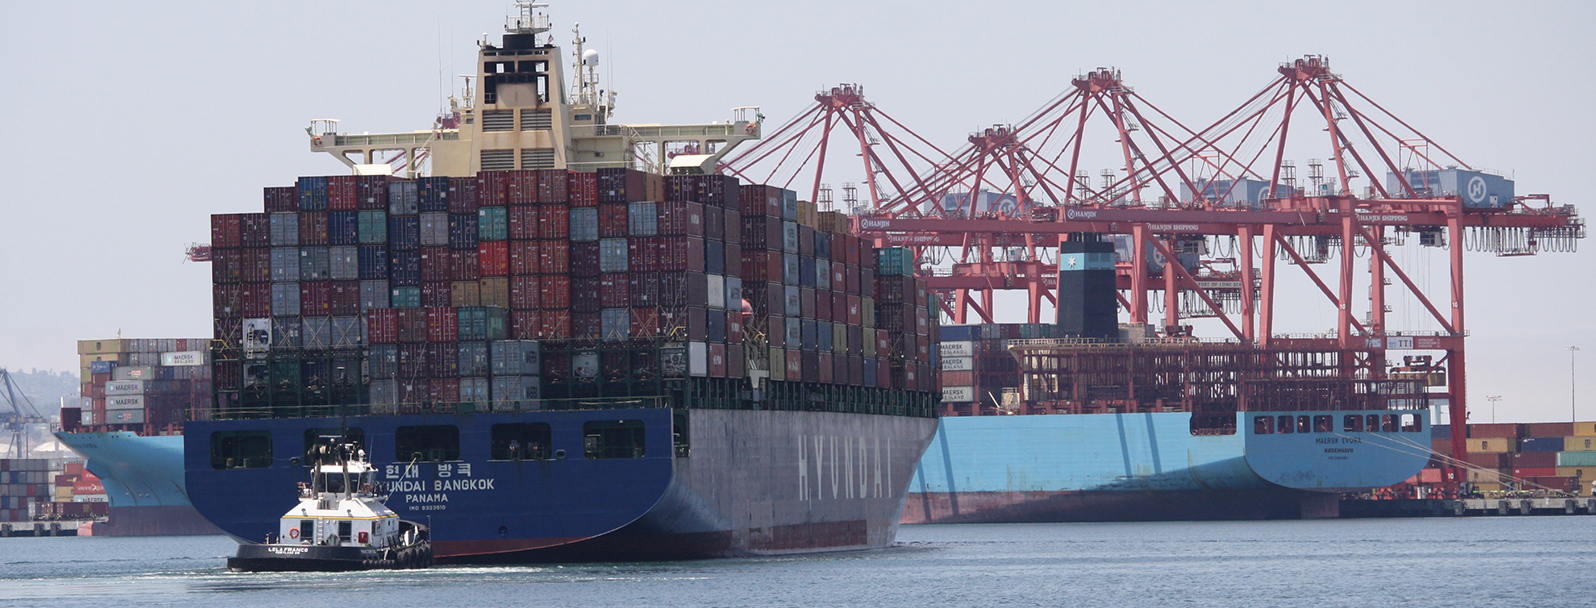
For large vessels entering port where there is next to zero margin for error, pilots and shipmasters are looking for the highest resolution data available to help them navigate these tight spaces safely and efficiently. NOAA’s Office of Coast Survey recently constructed and released 16 high-definition (HD), band 6 (or berthing scale) electronic navigational charts for Los Angeles/Long Beach Harbor, providing mariners with the best charts available to do their job.
Continue reading “High-definition charts advance precision marine navigation”