 An
official website of the United States government.
Here's how you know we're official.
An
official website of the United States government.
Here's how you know we're official.
An
official website of the United States government.
Here's how you know we're official.
An
official website of the United States government.
Here's how you know we're official.
Tools of the Trade
The Office of Coast Survey conducts hydrographic surveys utilizing many different specialized equipment. From sonars to tide stations, each piece of equipment fill a special role in producing accurate nautical charts to keep the mariner safe.
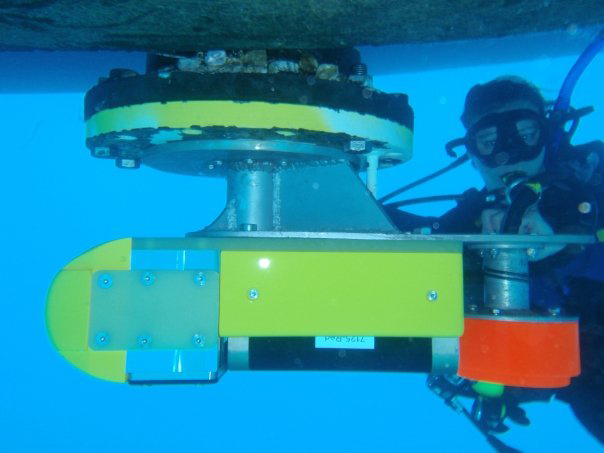 Multibeam sonars are secured to the bottom of the vessel to collect data.
Multibeam echo sounders (MBES), like other sonar systems, transmit sound energy and analyze the return signal (echo) that has bounced off the seafloor or other objects. Multibeam sonars emit sound waves from directly beneath a ship's hull to produce fan-shaped coverage of the seafloor. These systems measure and record the time for the acoustic signal to travel from the transmitter (transducer) to the seafloor (or object) and back to the receiver. Multibeam sonars produce a “swath” of soundings (i.e., depths) to ensure full coverage of an area. The coverage area on the seafloor is dependent on the depth of the water, typically two to four times the water depth.
Many MBES systems are capable of recording acoustic backscatter data. Multibeam backscatter is intensity data that can be processed to create low resolution imagery. Backscatter is co-registered with the bathymetry data and is often used to assist with bathymetric data interpretation and post-processing.
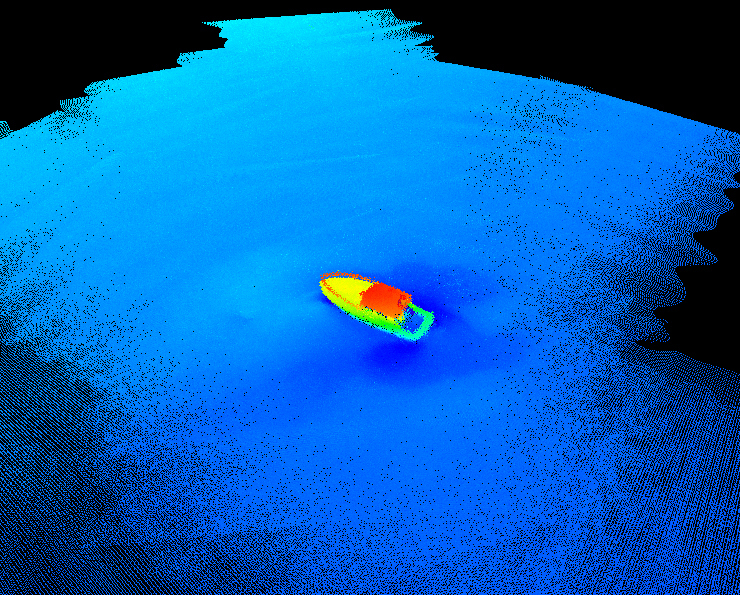 Small wreck found using multibeam sonar.
NOAA hydrographic survey units use mutlibeam echo sounder systems to acquire full- and partial- bottom bathymetric coverage throughout a survey area, to determine least depths over critical items such as wrecks, obstructions, and dangers-to-navigation, and for general object detection. NOAA field units use various models of swath-type multibeam systems both hull and pole mounted for hydrographic survey operations. Mutlibeam echo sounder systems employed must meet specifications outlined in the NOS Hydrographic Surveys Specifications and Deliverables.
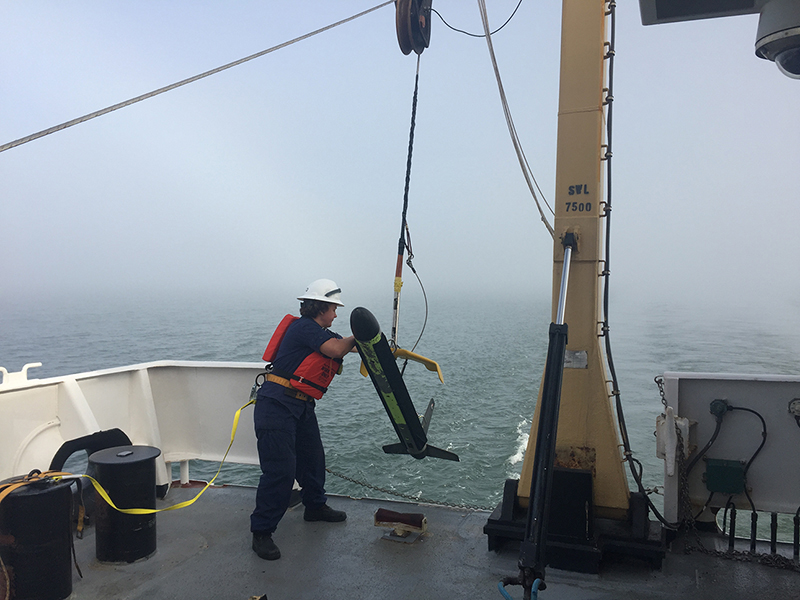 Side scan sonar deployed on NOAA Ship Thomas Jefferson.
Side scan sonar is a specialized sonar system for searching and detecting objects on the seafloor. Like other sonars, a side scan transmits sound energy and analyzes the return signal (echo) that bounced off the seafloor or other objects. Side scan sonar typically consists of three basic components: a towfish, a transmission cable and the topside processing unit. In a side scan the transmitted energy is formed into the shape of a fan that sweeps the seafloor from directly under the towfish to either side, typically to a distance of 100 meters.
The strength of the return echo is continuously recorded creating a "picture" of the ocean bottom. For example, objects or features that protrude from the seafloor create a strong return (creating a light area) and shadows from these objects create little or no return signal (creating a dark area). While the shape of the seafloor and objects on it can be well-depicted, most side scan systems cannot provide any depth information.
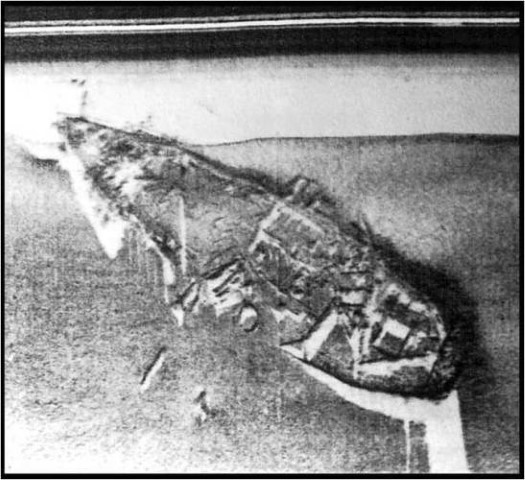 Side scan imagery helps find and identify features on the seafloor, like this
underwater wreck.
Side scan imagery helps find and identify features on the seafloor, like this
underwater wreck.
NOAA hydrographic survey units use side scan sonar systems for both object detection and object recognition. Side scan sonar is typically used in conjunction with a single beam or multibeam sonar system to meet full bottom coverage specifications for Coast Survey surveys. NOAA field units use various models of side scan sonar in both hull mounted and towed configurations for hydrographic survey operations. Any side scan sonar system employed must meet the specifications outlined in the NOS Hydrographic Surveys Specifications and Deliverables.
Lidar (light detection and ranging) technology measures elevation or depth by analyzing the reflection of pulses of laser light off an object. Lidar survey systems are typically aircraft mounted and provide seamless, contiguous coverage between land and sea.
Bathymetric lidar is used to determine water depth by measuring the time delay between the transmission of a pulse and its return signal. Systems use laser pulses received at two frequencies: a lower frequency infrared pulse is reflected off the sea surface, while a higher frequency green laser penetrates through the water column and reflects off the bottom. Analyses of these two distinct pulses are used to establish water depths and shoreline elevations. With good water clarity, these systems can reach depths of 50 meters.
Bathymetric lidar is also used to acquire data in areas with complex and rugged shorelines where surface vessels cannot operate efficiently or safely because of rocks, kelp or breaking surf. Some examples of these areas include Alaska, the North Atlantic Coast and the Caribbean.
Using a similar technology as bathymetric lidar, many NOAA field units have installed topographic lasers on their survey launches to measure and locate features such as rocks, islets, and small islands. The laser head produces sixteen laser beams, which reflect off the target object and are received back by the laser head. The computer then uses that data along with precise positioning and attitude (roll, pitch, and yaw) data, to determine the height and location of the object. Unlike airborne lidar units that obtain shallow water bathymetry, the ships' laser cannot penetrate the water.
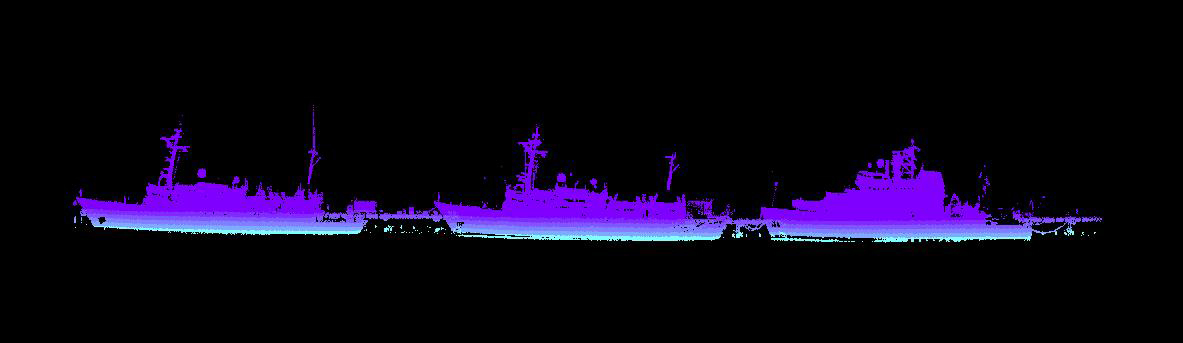 Laser images of NOAA ships Fairweather, Rainier, and Shimada moored at the Marine
Operations Center- Pacific acquired during training.
Laser images of NOAA ships Fairweather, Rainier, and Shimada moored at the Marine
Operations Center- Pacific acquired during training.
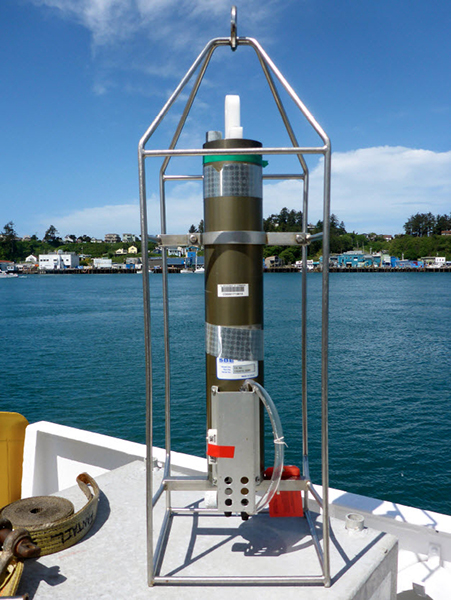 Conductivity, Temperature, and Depth (CTD) unit utilized by NOAA field units.
Collecting bathymetry with sonars in the marine environment means measuring the path and travel distance of sound from the transmit point, to the seabed, and back again to the receive point. Refraction occurs when the speed of a wave changes due to a change in medium in which the wave is traveling through. Waves traveling through media of different density cause refraction. The density of water is affected by the salinity, temperature, and depth of the water. To measure the density of water the Coast Survey utilizes different types of sound velocity profilers.
The conductivity, temperature, and depth (CTD) unit contains several integrated sensors that allow the user to sample many density profiles and transfer them to a computer. The CTD has a pressure sensor to measure depth and a small impeller to actively siphon water across the temperature-reading thermistor and the conductivity-measuring circuit. By measuring conductivity, pressure, and temperature, simultaneously, the CTD can calculate the sound speed in water using the Chen-Millero equation. The rigid cage around the CTD ensures that the vital cables and sensors are kept a safe distance away from potential damage. Hydrographers should only use the CTD unit when the survey platform is stationary. A moving vessel profiler (MVP) can deploy at survey speed, and travel the entire water column. The MVP system is a self-contained profiling system capable of sampling water column profiles to 200m depth from a vessel moving at up to 12 knots, and deeper depths at slower speeds.
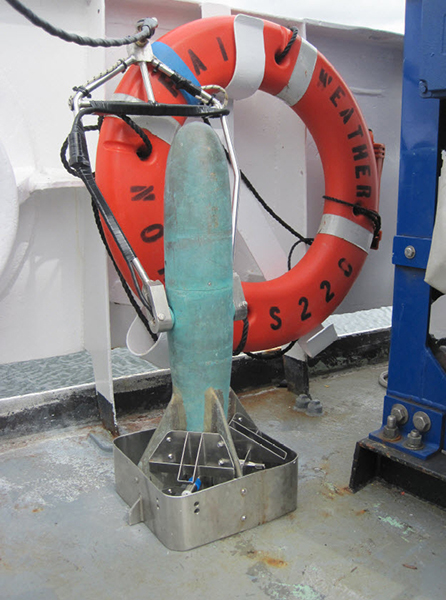 Moving Vessel Profiler (MVP) utilized by NOAA field units.
The MVP is completely autonomous and can be controlled by computer without the requirement for personnel on deck. The benefits to deploying a sound speed profiler at speed is significant, especially with the fleet ships. Stopping and remaining on station for periodic sound speed profiles can mean a significant drop in efficiency given how long it can take to stop and then resume survey operations.
Laser images of NOAA ships Fairweather, Rainier, and Shimada moored at the Marine
Operations Center- Pacific acquired during training.
The Global Positioning System (GPS) is the basis for nearly all position measurement in NOAA hydrography. In addition to providing location information for survey ships and launches, accurate positioning is required for several other elements of coastal hydrography.
Fixed Aids to Navigation (ATONs) are occasionally found to be out of their published positions. The location of these ATONS must be accurately measured for charting. NOAA utilizes static GPS survey methods to position critical Aids to sub-meter level accuracy.
NOAA utilizes USCG-maintained differential GPS beacons to improve the accuracy of position measurements. However, in some remote areas far from permanent differential beacons or where local topography blocks the beacon's signal, NOAA establishes its own temporary DGPS station to broadcast correctors to the survey launches.
Nearshore features such as pilings and piers must be portrayed accurately on nautical charts. While remote sensing methods such as aerial photogrametry are usually the most efficient means of positioning these items, Rainier often locates new features which do not appear in the latest remote sensing data. In these cases, hydrographers use portable backpack DGPS receivers to define the position, extents, and attributes of these items.
NOAA is also working to establish the relationship between local water level datums such as Mean Lower Low Water, and Ellipsoidal Height produced by GPS. To assist in this effort, NOAA uses dual frequency static GPS methods to measure the ellipsoidal height of water level (tide) stations to centimeter level accuracy.
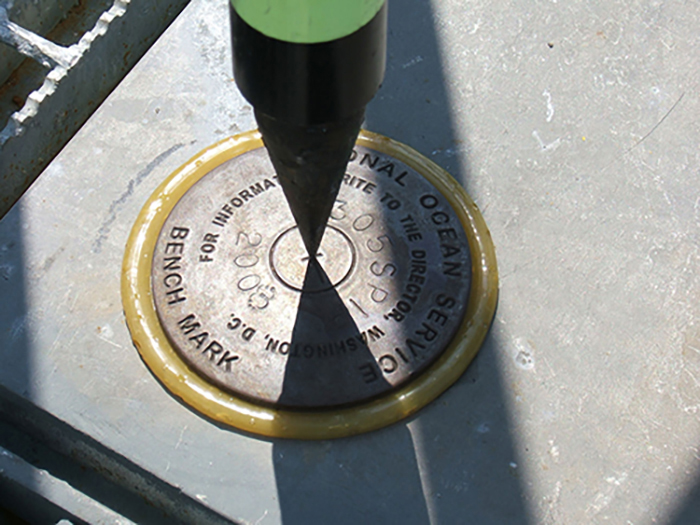 The Benchmark represents a vertical datum reference point and establishing its permanence is vital.
Depths on NOAA nautical charts of tidal waters are relative to the local Mean Lower Low Water (MLLW) datum. Determining this datum and accurate water level correctors for hydrography requires a network of water level measurement stations. In remote areas, NOAA hydrographic field parties establish temporary land-based tide gauges, or tertiary control stations, to complement the permanent National Water Level Observation Network (NWLON) tide stations maintained by NOAA's Center for Operational and Oceanographic Products and Services (CO-OPS).
The tide gauge set-up consists of a computer housed inside a weather-proof case, batteries and a solar panel, a nitrogen tank connected to an orifice on the seafloor, a graduated staff, and components for a satellite uplink. The gas-purged pressure gauge has a sensor to measure the water level above the orifice. In addition, a set of tidal benchmarks are installed around the gauge site so that the water level data collected by the gauge can be reduced to the tidal datum used for NOAA's hydrographic survey operations. When the elevation of the primary benchmark relative to the orifice is known, the tertiary station data can then be reduced to tidal datum and compared to a NWLON station.
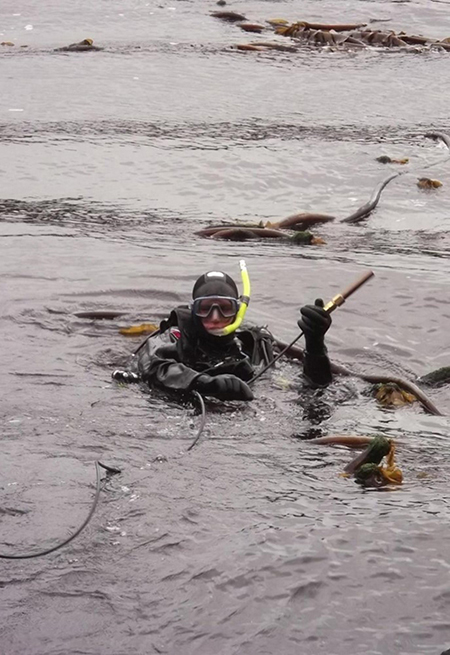 NOAA working diver placing orifice tubing for tide station in Alaska.
The orifice must be attached to a plate, which is then weighted to the bottom with dive weights, chain, or rock. Nitrogen tanks on land are employed to feed gas to the orifice on the sea floor.
The benchmarks are leveled to a graduated staff that is also semi-permanently installed at sea level, on which water level observations are taken periodically during the station occupation. Leveling is conducted with a collimated optical instrument set on an undisturbed tripod, which allows the operator to read the level rod to the nearest millimeter.