An
official website of the United States government.
Here's how you know we're official.
An
official website of the United States government.
Here's how you know we're official.
An
official website of the United States government.
Here's how you know we're official.
An
official website of the United States government.
Here's how you know we're official.
nowCOAST™
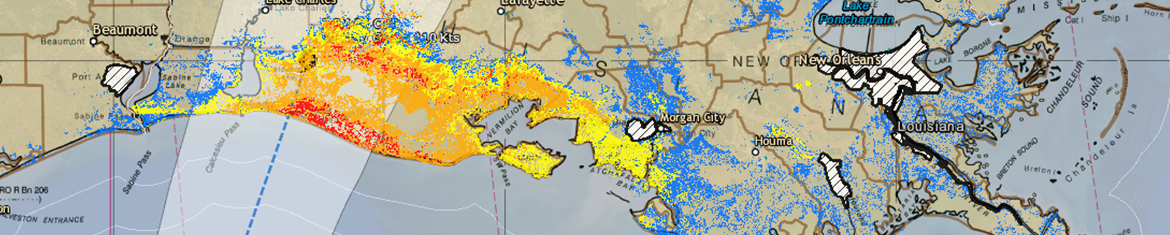
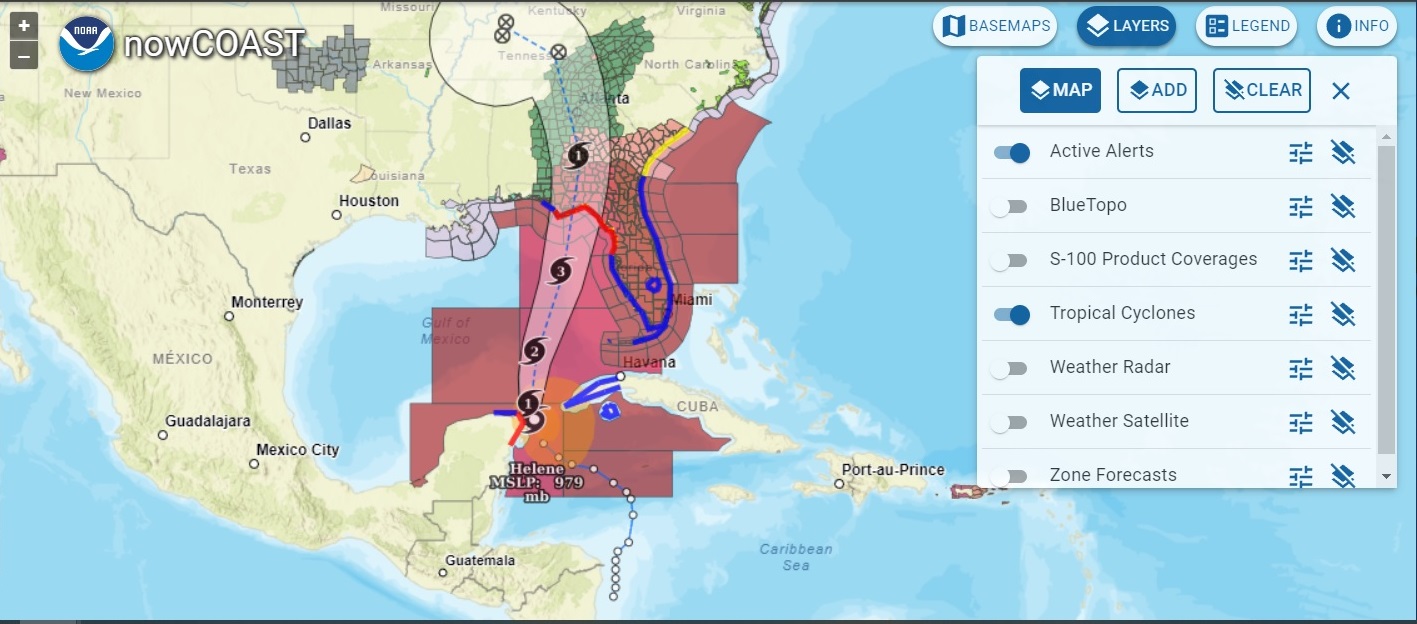
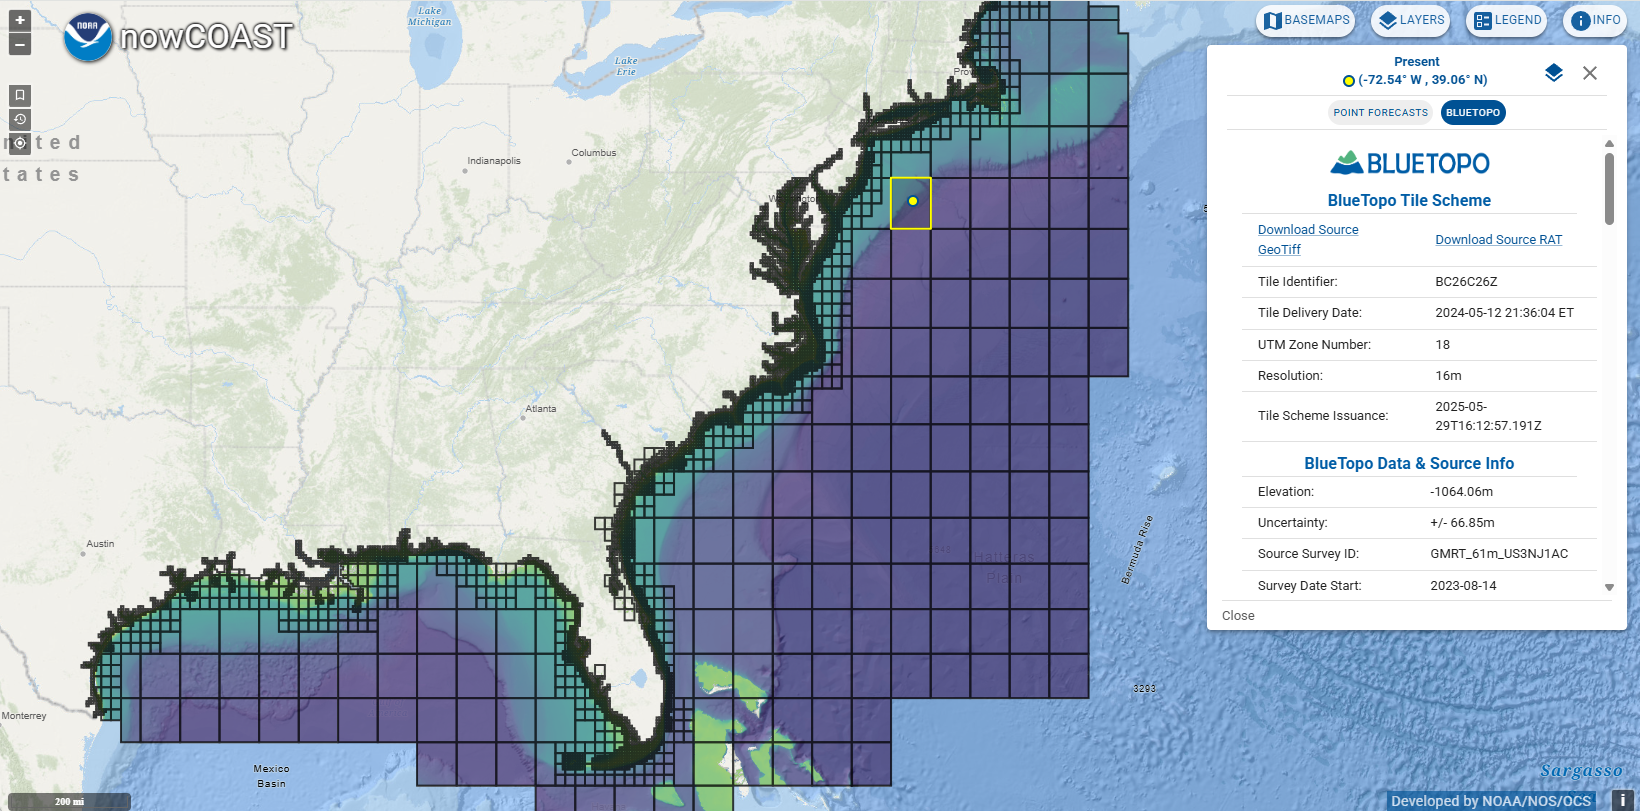
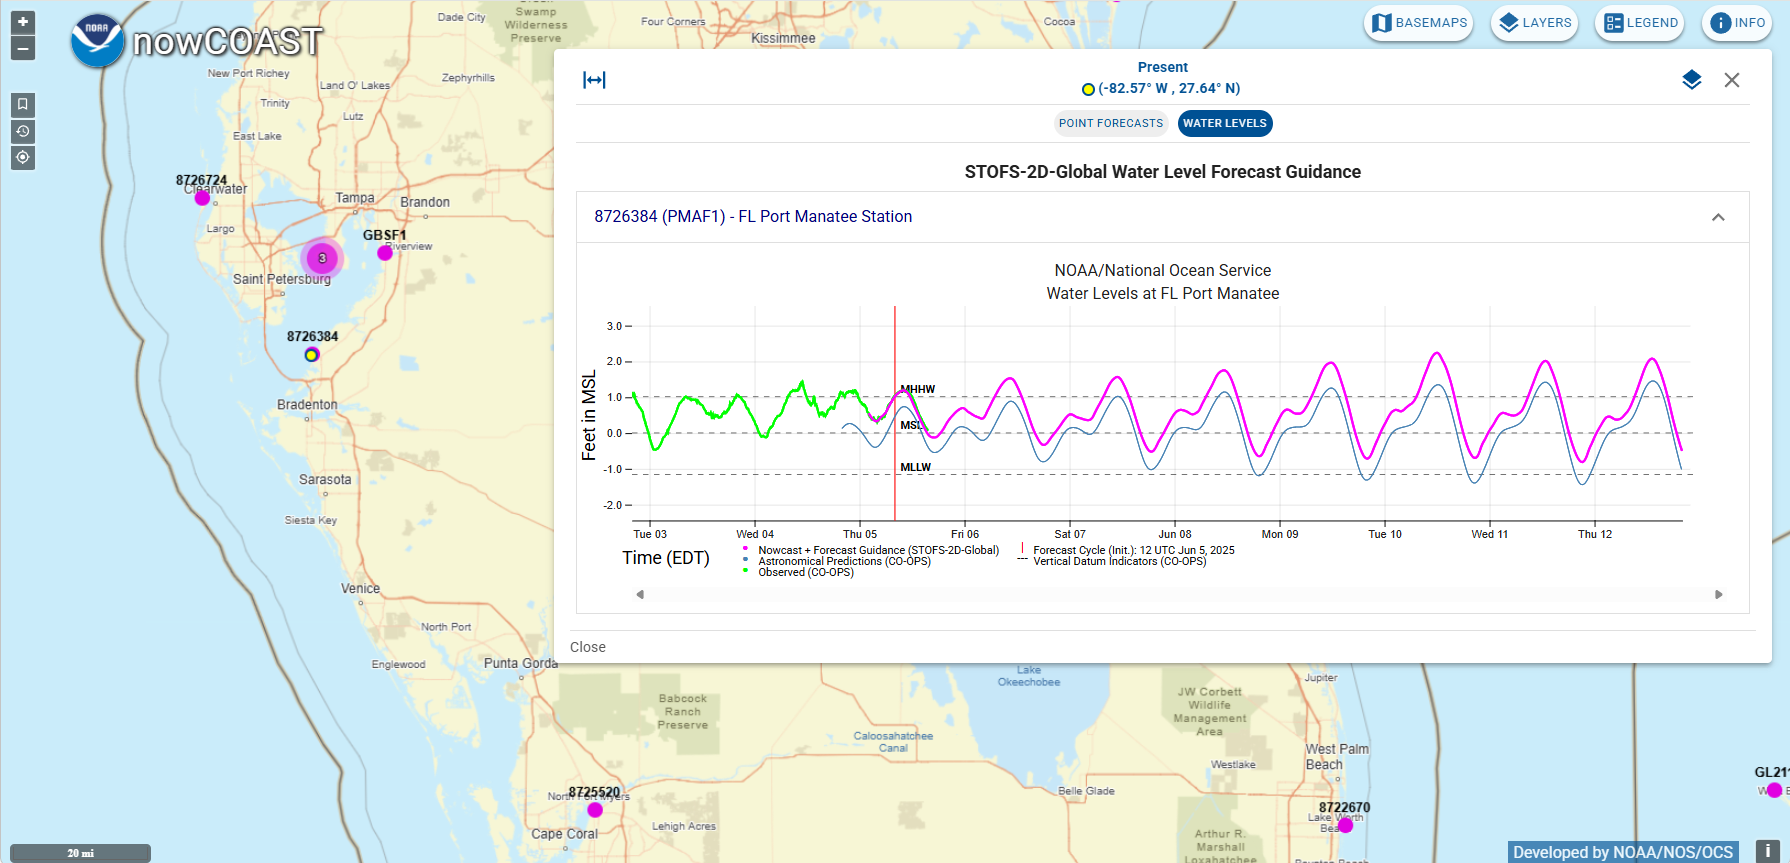
Office of Coast Survey's nowCOAST™ is a GIS-based web mapping application providing present and future oceanographic, meteorological, and hydrologic information (observations, analyses, forecasts, alerts) from NOAA along with bathymetric data for U.S. coastal areas to support public safety, coastal preparedness, response, and precision marine navigation. Some of the data and information available from nowCOAST includes:
Users can consume this information using nowCOAST's interactive map viewer or by connecting to its map services directly from their own applications. The nowCOAST map viewer allows users to zoom and pan, choose different map backgrounds and overlays, animate time-enabled data layers, and select a location on the map to obtain the latest weather or marine weather forecast for that specific location. Alternatively, by integrating with nowCOAST's time-enabled map services (using OGC Web Map Service protocols), users can retrieve raw data, visualizations, or imagery directly from nowCOAST and display them in their own applications alongside other map layers of interest.
NowCOAST is used daily by the maritime community (commercial and recreational mariners, port authorities) and the federal, state, and local emergency management community to support informed timely decisions on a daily basis.