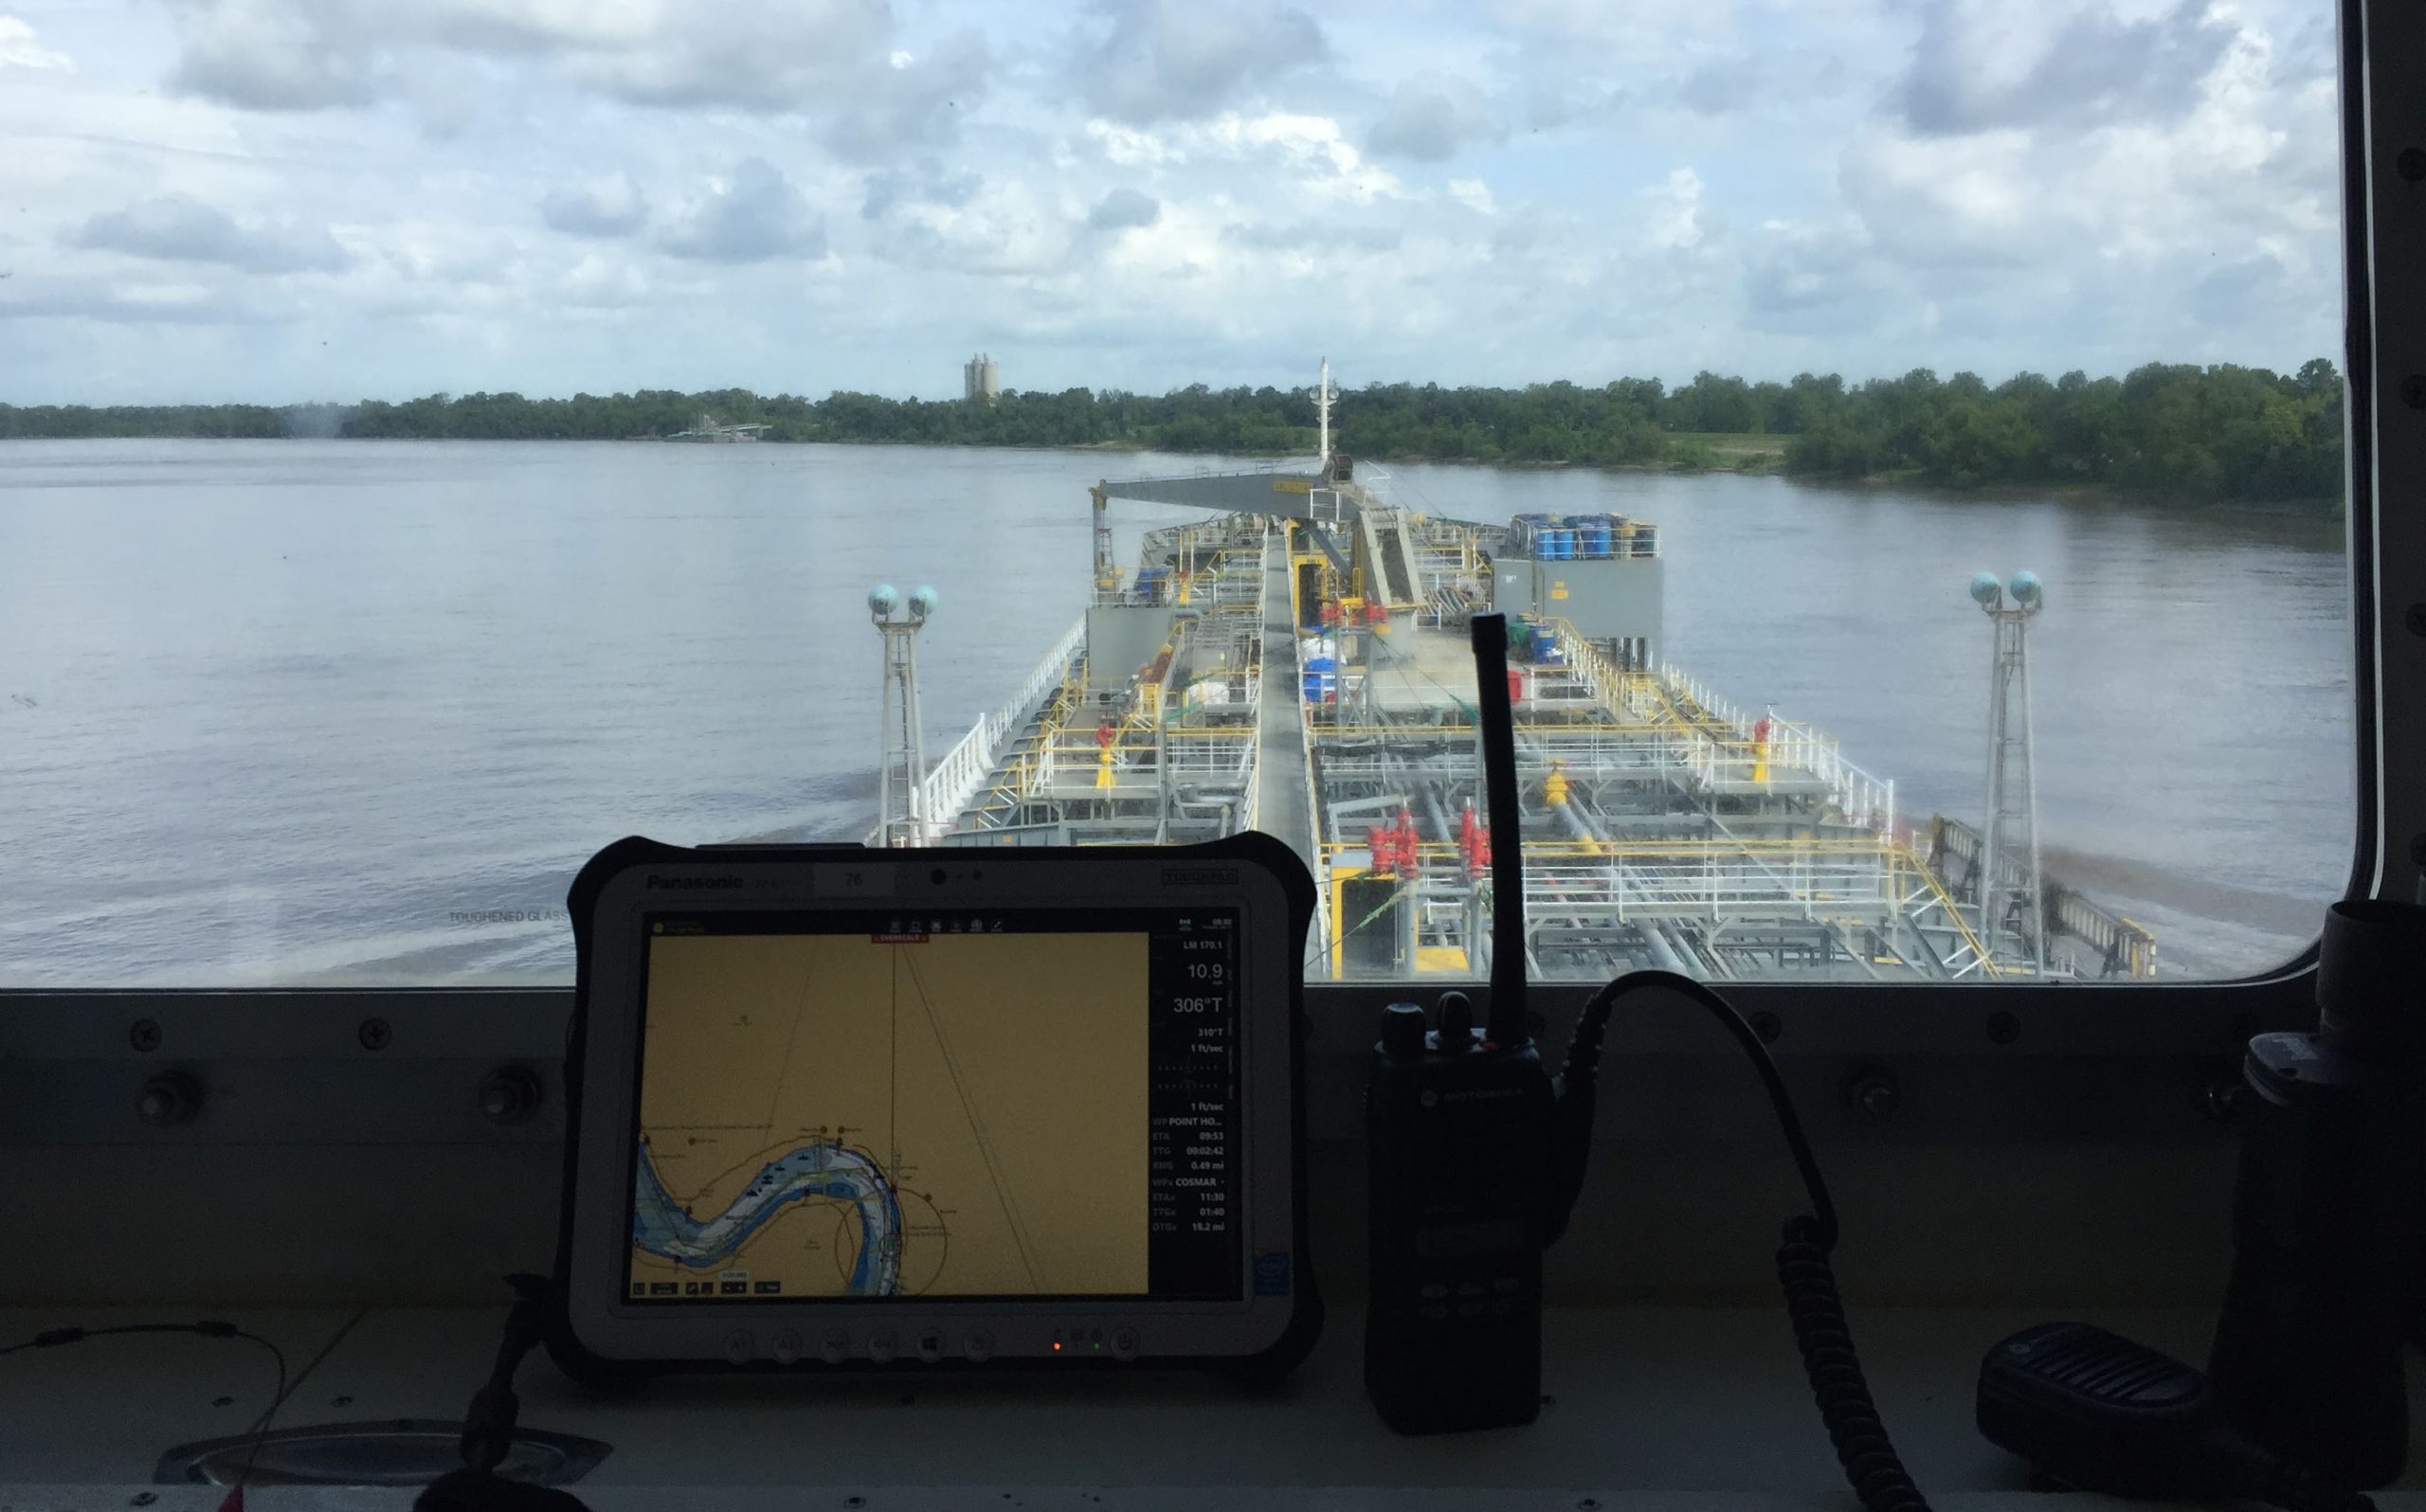
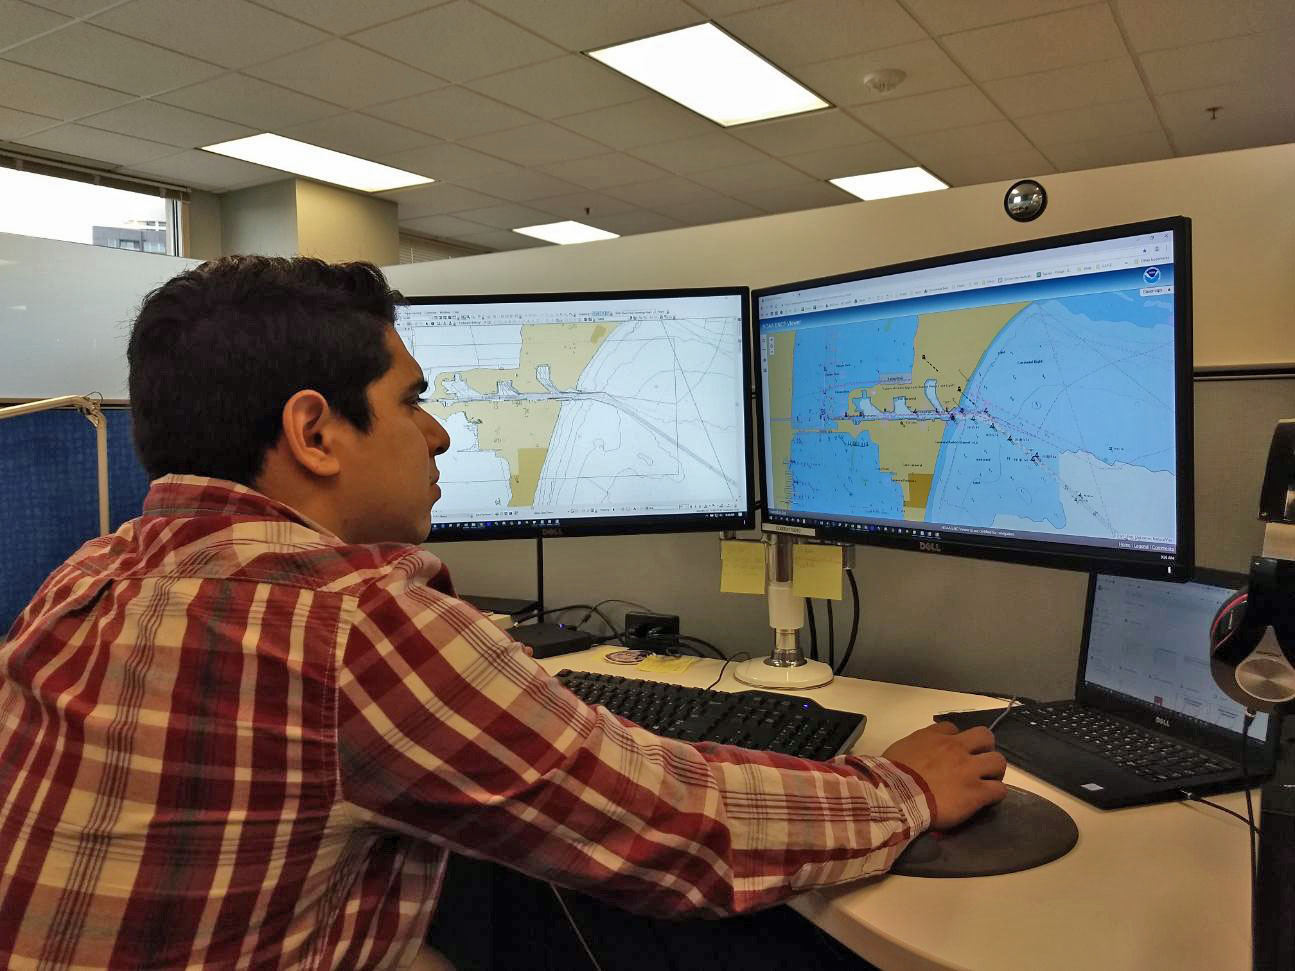
NOAA’s Office of Coast Survey maintains a suite of over 1,000 NOAA electronic navigational charts (ENC) and paper nautical charts, and like many other chart producing nations, maintains an ENC focused production process called “ENC-first.” That is, ENCs are the “first” or primary nautical product, and new data is compiled onto ENCs before all other products.

NOAA ENC® data was originally created by digitizing paper nautical charts – starting in the early 1990s – but ENCs are now considered NOAA’s primary nautical chart product. NOAA’s production process is now reversed. That is, new source data and critical corrections are compiled into NOAA’s ENC production database first and the compiled portrayal of that data is subsequently applied to the corresponding paper charts and their associated digital raster products. This sequential compilation process ensures the consistent equivalent portrayal of data between ENCs and paper nautical charts.
In this blog, when discussing aspects of paper charts and paper chart production, the same factors also apply to all corresponding digital raster chart products. These digital images, identical to NOAA paper nautical charts, include the NOAA raster navigational chart (NOAA RNC®) – also known as BSB format, full-size and booklet charts released as PDF files, and RNC tile service data.
Synchronization of NOAA ENC and paper nautical charts
Because new chart source data is applied to ENCs first, there can be a delay of a month or more before the same information appears on paper nautical charts and their raster chart equivalents. This is a characteristic of the standard production process. This enables NOAA to provide the public with updated information as early as possible – in ENCs. Strict synchronization of ENC and raster products would require holding back the release of updated ENCs to enable the paper charts to catch up. Releasing ENCs first is in the best interest of safe navigation.

Data that could appear on ENCs before paper nautical charts
Coast Survey receives many types of data to compile on its nautical chart products. Chief among these are hydrographic surveys used to update water depth values and the positions of rocks, wrecks, and other hazards; and topographic surveys used to update shorelines and some landmarks. The application of these surveys usually constitutes a major update for ENCs and paper charts. After compilation, this data is released to the public at the next weekly update of ENC products, which usually occurs on Thursdays. This same data may not appear on some paper charts for up to a month or longer, and in some cases, it may not be published until the next new edition of the chart, which could be several months or even a few years away.
NOAA strives to keep both ENC and raster products up-to-date with Notice to Mariner corrections, but again, because NOAA does not hold back the release of this critical data, there can be a variation in the timing of Notice to Mariner based correction releases between products.
ENC data that is not available on paper nautical charts
Data that is only available on ENCs includes the minimum (also called controlling) depths of navigational channels maintained by the U.S Army Corps of Engineers. NOAA is transitioning its paper nautical charts to show only the channel project design depths in many ports. New minimum channel depths are provided as often as monthly for some channels. Read more about this on the “NOAA announces change in channel depths on raster nautical chart products,” blog post.
Similar to the source diagrams on paper nautical charts, ENCs also provide a graphic representation of the extents of hydrographic surveys used to compile the depth data on the ENC. However, unlike the diagrams on a paper chart, the quality of the surveys – indicated by a number of stars – may be toggled on and off over the ENC data itself. This is easier than trying to match an area on a chart to the chart’s source diagram and then look up a quality category keyed to a letter shown on the diagram.
A new note will soon appear on all paper nautical charts
To reinforce the new nature of our nautical chart products in the ENC-first chart production environment, NOAA has started to place a note on all paper nautical charts that will encourage nautical chart users to take advantage of the benefits of using ENCs.
Other advantages of using ENCs
Low Cost Option – NOAA ENCs and ENC updates may be downloaded for free from the Coast Survey website. They are also available from a number of value added resellers who offer services such as increased security through encryption and managed chart updates. Generally, NOAA paper nautical charts each cost $20 or more.
Larger Scale Coverage – As part of a multi-year transition, many areas of ENC coverage will be offered at a larger scale. Larger scale charts will offer more detail, including features such as high-density depth contours. This more detailed data will only be available in the ENC format. There are no plans to create new, larger scale paper charts.
Easier to Update – No hand corrections are needed on ENCs as is the case to update paper nautical charts. Loading ENC revision files automatically apply all the latest ENC updates. ENC updates are available weekly from NOAA and its value added resellers.
Less Clutter / Smarter Data – The database within each ENC enables users to turn the display of certain features and groups of text on and off on many navigational systems or chart plotters. This can reduce clutter and make other important features easier to see that are more relevant for a particular activity in which a ship is engaged. The minimum scale attribute that is encoded for many ENC features also enables systems to suppress the display of certain features when a chart is zoomed out to a point where a feature’s display would clutter the chart. ENC data also has additional information that can be accessed by a mouse click (or query) on a chart display. This includes information about the date and origin of the source data used to compile features on the ENC, any text associated with a feature, such as place names or light characteristics for buoys and other aids to navigation, can be turned off by the user, but quickly accessed by a query.
Added Level of Safety – Many navigational systems – including all the systems used by large commercial vessels – take advantage of the ENC’s database of depth areas, dangers to navigation, and regulated or restricted areas. These systems use information in ENCs, as well as the ship’s draft input by the mariner, and information from the ship’s sensors, such as a GPS receiver, to plot the ships position, speed, and direction; the system can then also determine if the ship is heading in to unsafe waters. Having this data available enables these systems to initiate visual and auditory alarms to alert the crew when a ship is moving into a dangerous condition, such as deviating from its planned course, entering an area shoaler than the ship’s draft, or entering other dangerous or restricted areas.
Always Oriented Correctly – ENCs have no inherent orientation. That means no matter if the ENC display is set to display “north up,” “course up,” or some other orientation, the symbols and text on the digital chart display will always be displayed facing up for easy reading and interpretation.
NOAA Custom Chart – This capability, currently being prototyped by Coast Survey, will enable users to define the extent, scale, and paper size of their own customized paper chart, created from the latest ENC data and output as a PDF file. Recreation boaters may print these files to use as a backup for their chart display systems or for small scale overview planning.
